Case Study
Service Performance Insights
Turning fragmented service metrics into a dashboard teams could trust, use, and act on.
Context
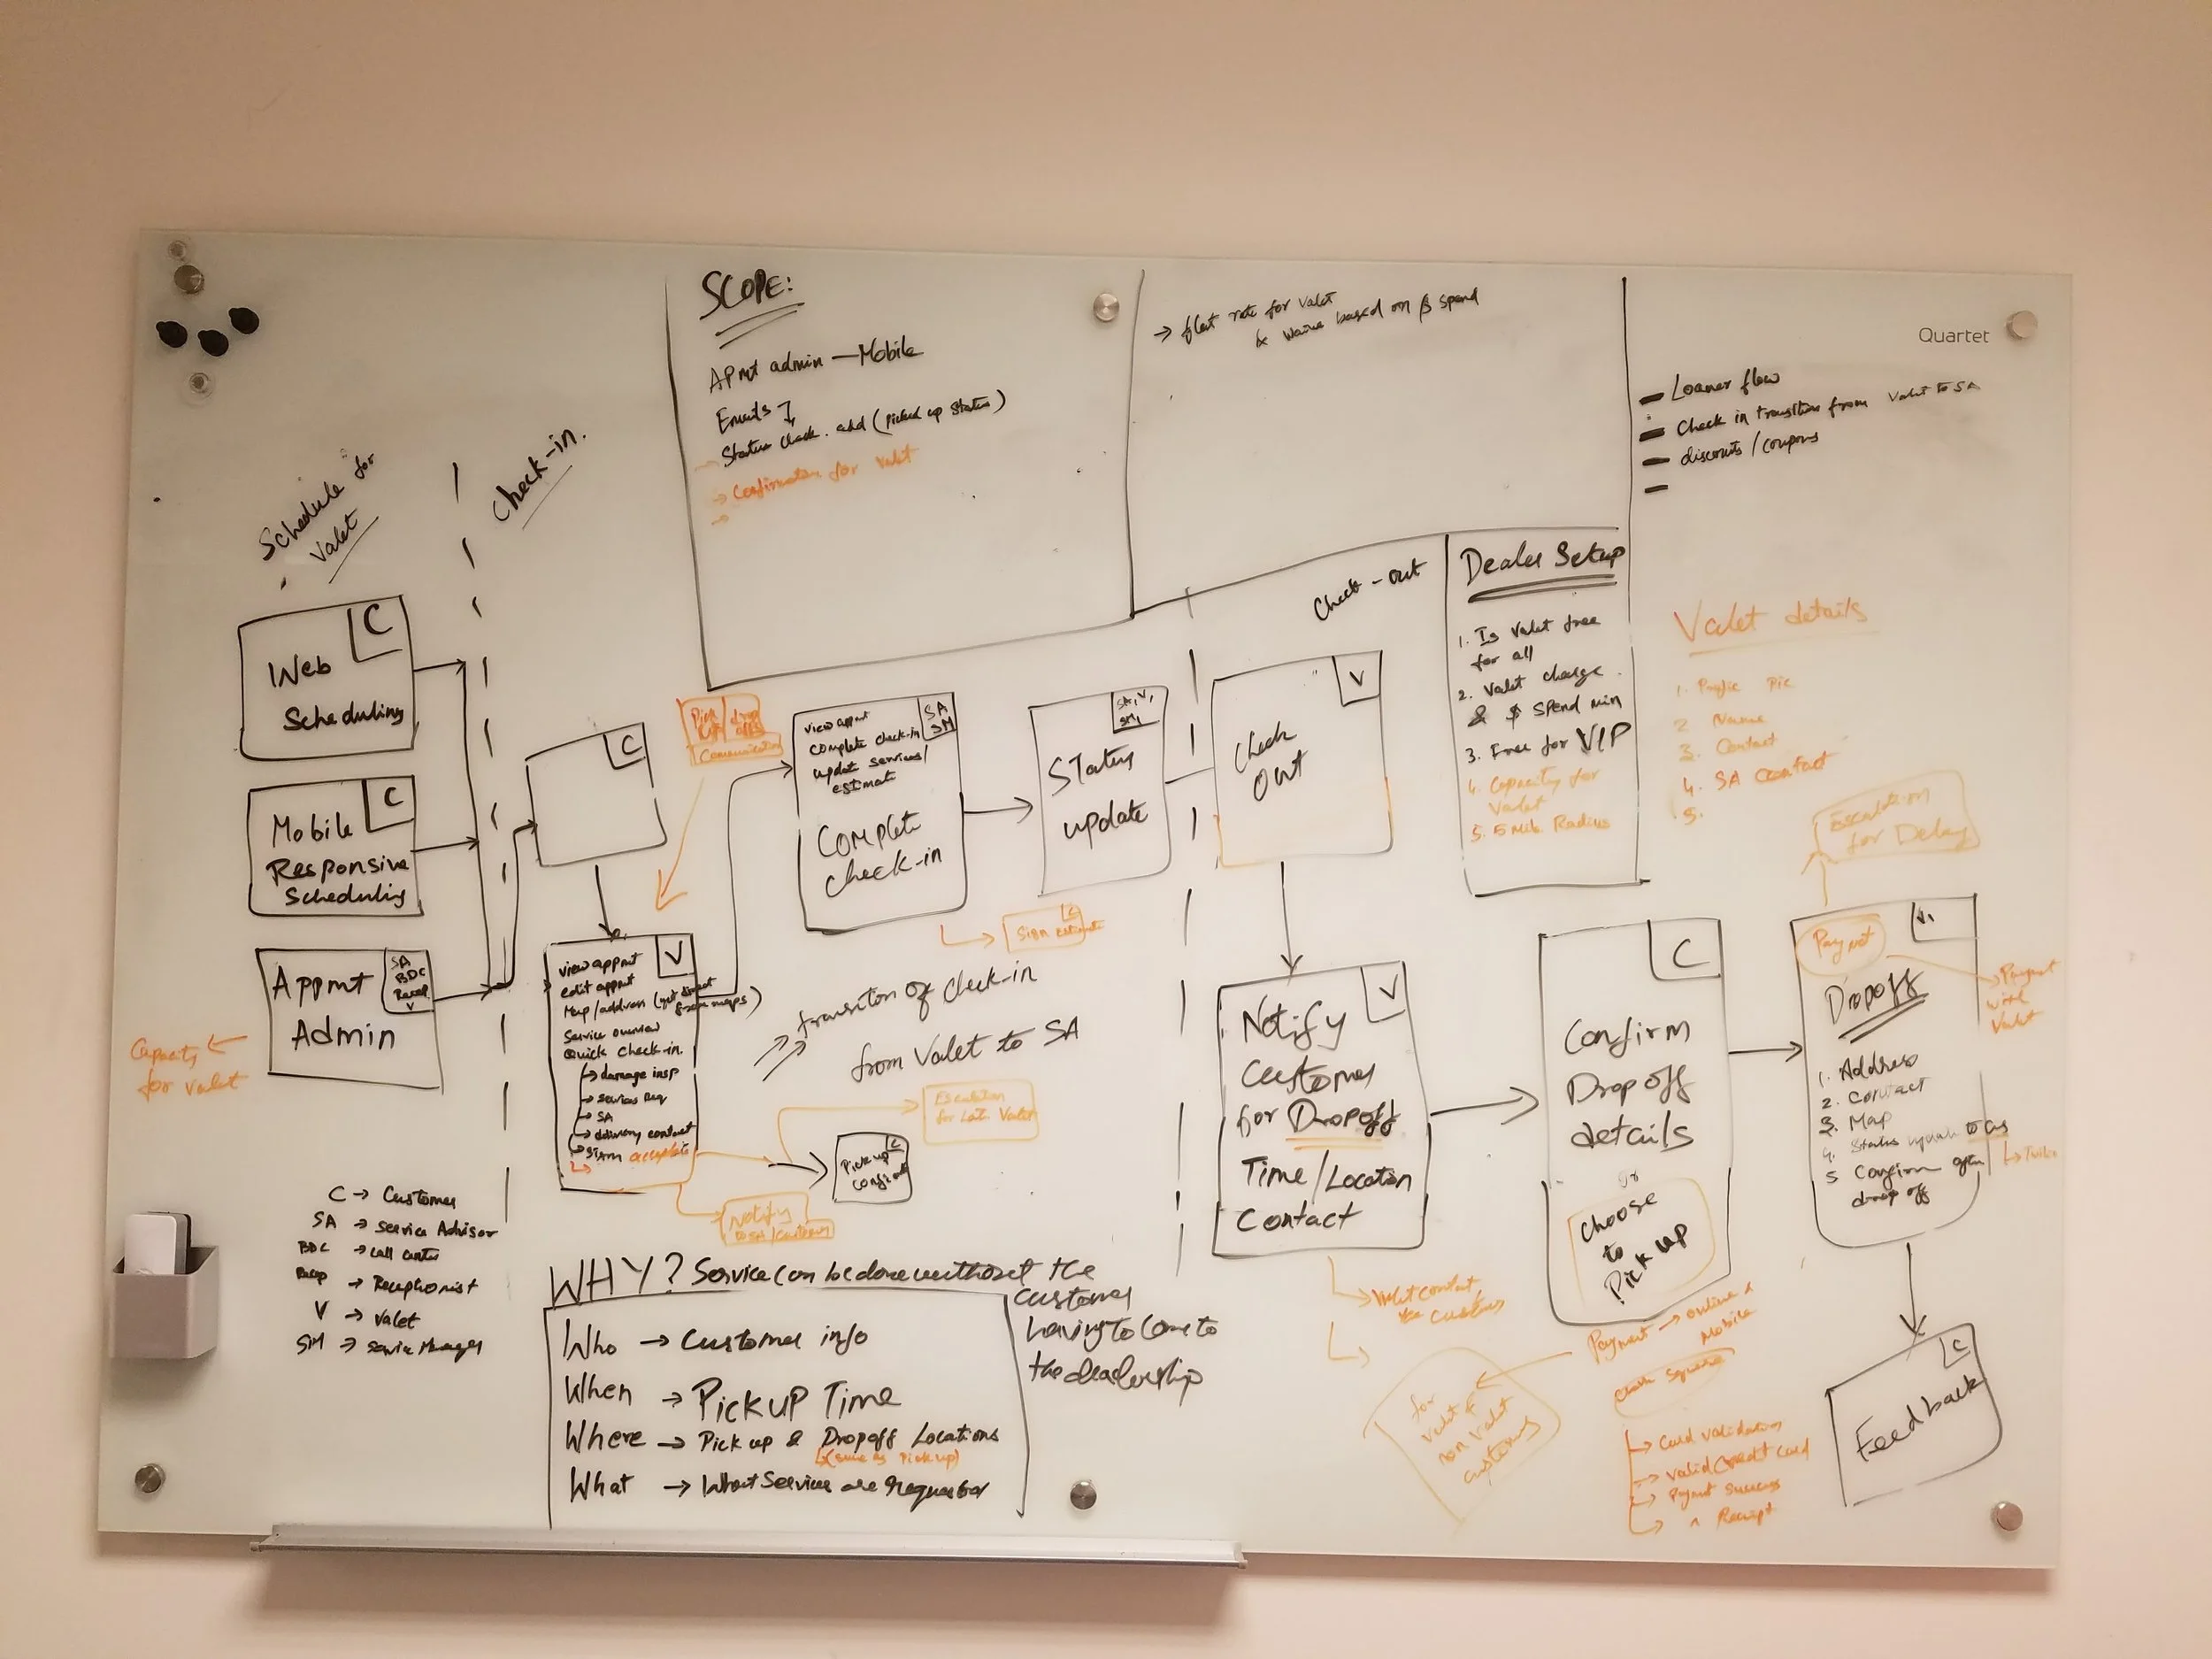
Service blind spots were slowing proactive management.
The service department had fragmented visibility into performance metrics against forecasts and historical benchmarks, making it harder to understand what was changing and where action was needed.
Insight
Research and feedback pointed to clarity, context, and flexibility.
The work centered on understanding where dashboard users were losing time, where KPI views lacked enough context, and how user feedback could continuously improve the experience.
Strategy
Design for operational efficiency, adoption, and better insight quality.
Operational Efficiency
Enable data-driven decision-making for service departments.
User Adoption
Increase engagement through simplified, intuitive interface design.
Data Insights
Leverage NLP to surface performance drivers and recommendations.
Customer Experience
Refine the dashboard through continuous user feedback.
Execution
Five core deliverables shaped the product direction.
- Enhanced Data Layer: Strengthened Pulse infrastructure for metric accuracy.
- Customer Feedback Loop: Continuously integrated user insights.
- Refined Overview UX: Redesigned the landing page to emphasize key KPIs.
- NLP-Powered Insights: Automated trend analysis and contextualized recommendations.
- Repair Type Analysis: Added performance breakdowns by repair category.
Impact
Measurable gains in adoption, efficiency, and service visibility.
- Dashboard adoption grew significantly post-launch, becoming the default tool for service managers (exact figures under NDA).
- Service teams reduced time spent on manual reporting, freeing hours per week for proactive management.
- NLP-powered insights drove repeat engagement — users returned to the feature weekly to review trend summaries.
- Usability scores improved after the KPI-first redesign, validated through direct dealer feedback sessions.
Reflection
Progressive disclosure kept the dashboard useful without overloading the user.
The solution combined clear visualizations, daily-to-monthly views, and natural language insights so teams could move from high-level signals to actionable detail without losing trust in the data.
Technical deep dive
The product direction paired a stronger metric foundation with more contextual UX: Pulse data accuracy improvements, KPI-first overview patterns, repair-type segmentation, and NLP-based trend detection that translated complex service performance shifts into more actionable recommendations.